When you click on the ‘Leader Reports’ button, you will then see a string of color coded reports. Click on the colored icons under your chapter's name to run your report. Use the color coded symbols in the report index above.

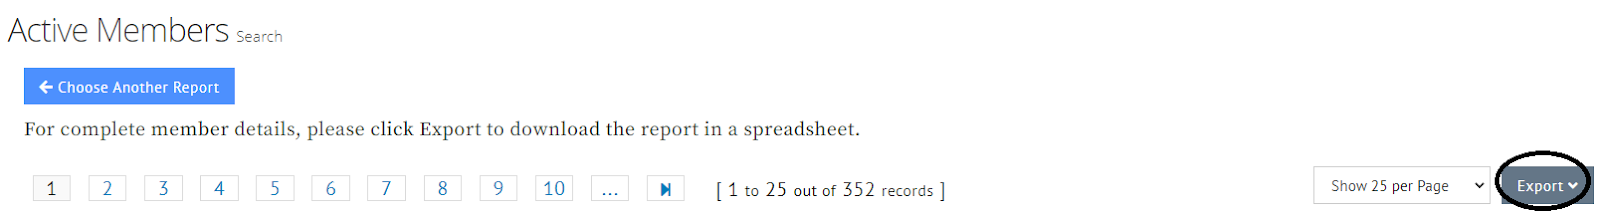
Once you click on one of the report buttons, the report details will appear. To export a report, click export on the right side of the page and you will have the option to download the report as a CSV.